Automated Network
& Service Management

With StableNet®, you can automate management of even the most complex network infrastructures
StableNet® provides Discovery, Configuration, Fault and Performance Management and brings the fragmented pieces of your multi-technology and multi-vendor network infrastructure together under a single platform.
The automated network & service management approach has been successfully implemented in key industries like energy, finance, manufacturing, retail, telecommunications, and many more.
From Automated root cause to Zero touch provisioning, find out how StableNet® continues to be the industry leader for enterprise and telco network management.
What’s new at StableNet®?
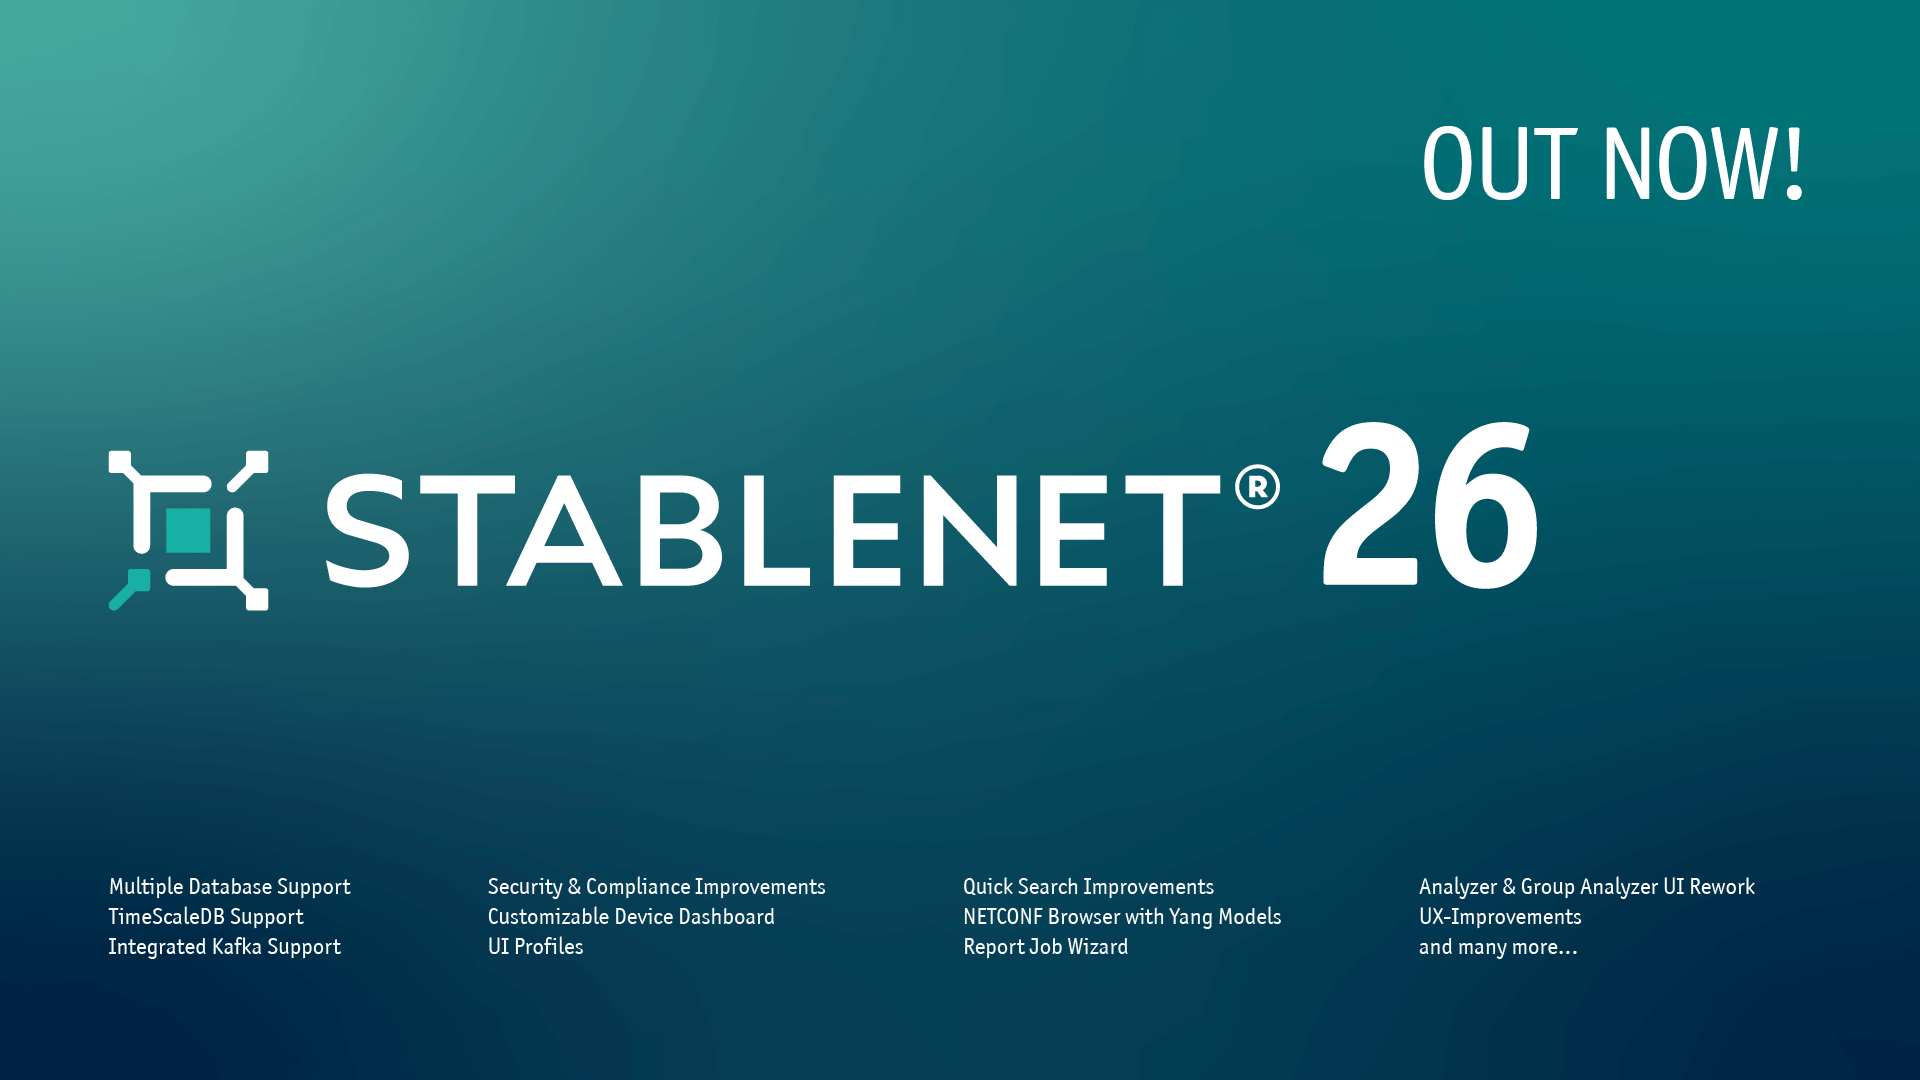
StableNet® 26 Service Pack 3 is out now!
For more information visit the StableNet® 26 Landing Page or go to Downloads.
StableNet® & Agentic AI
A walk through how to connect an LLM of your choice with StableNet® and first practical examples to get started. Watch the video
Getting Started with Data Center Environmental Monitoring
Read one of our latest blog post. More information.
Driving Innovation and Reliability for Africa’s Service Providers
Download our newest success story. More information.
StableNet® at a glance
As a leading 4-in-1 Solution, StableNet® covers functions from the following four pillars:

Discovery &
Inventory
Improve network efficiency
and capture your assets
for insights

Network Configuration & Change
Reduce configuration errors with vendor independent automation

Fault Management & Root Cause Analysis
Resolve network problems quickly by getting pinpointed to the root cause

Performance &
Service
Continuously measure KPIs and monitor SLAs to stay in control
Key Benefits of StableNet®
StableNet® unifies the management of multiple vendor-specific network tools and technologies, along with firm-specific databases, into one GUI.
The Automated Network & Service Management solution StableNet® delivers a flexible framework that is scalable to any sized network.
Customization
StableNet® provides an excellent out-of-the-box solution which can be further customized to accommodate individual requirements.
Ready for automated network management?
Automation is at the core of StableNet®

programming investments.
With StableNet® you can save considerable time and, in conjunction with the consolidation of functionalities, significantly reduce costs (OPEX and CAPEX).
The network automation workflow is an iterative process which begins with repeated checks and discovery of your
inventory and moves through simplified configuration jobs, root cause analysis and continuous SLA monitoring, compliance tracking, and simplified and automated backups and reporting (with many steps along the way). While each network is unique, with StableNet® you can greatly simplify even the most customized tasks.
Intelligence in every connection
StableNet® in Action: Popular Releases
Available Product Solutions
What our partners and customers say about us
Find out why StableNet® is so popular. Request a demo today.

Software
Made in Germany
Software
Made in Germany