Network Visualization & Mapping with StableNet®
See Your Entire Network Clearly with Advanced Network Visualization
For Telcos and Enterprise networks managing vast, multi-vendor, multi-layer networks, that kind of visualization is no longer a luxury — it’s a necessity. StableNet® transforms abstract network data into intuitive, dynamic visuals that empower teams to see, understand, and act faster.
From a single, unified interface, you can visualize end-to-end services across technologies, vendors, and geographies — eliminating blind spots and enabling real-time, informed decision-making.
Network Visualization Examples in StableNet®
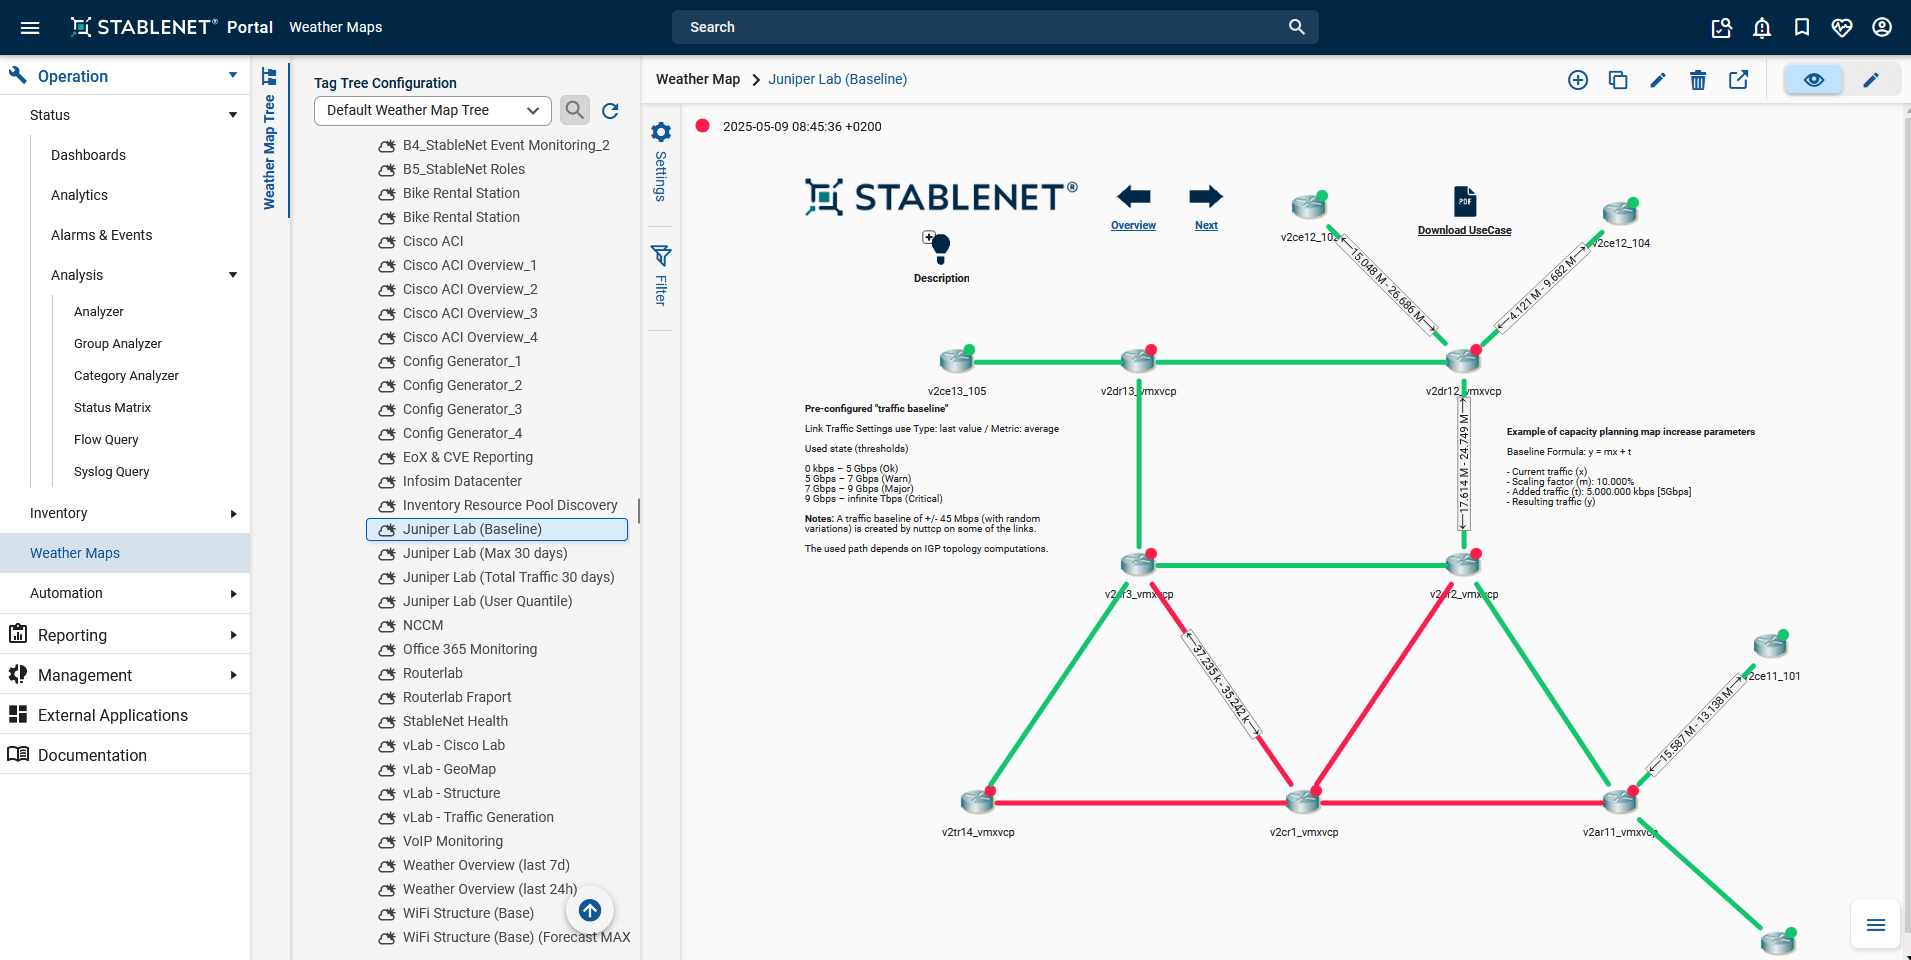
Network Maps
StableNet®’s network maps provide a real-time view of your entire infrastructure — from core routers to edge devices. These visualizations can be static or dynamic, depending on your needs: use static maps for clear documentation or dynamic, auto-updating maps for live monitoring. They help NOCs and engineers quickly identify topology changes, device status, and connectivity issues at a glance.
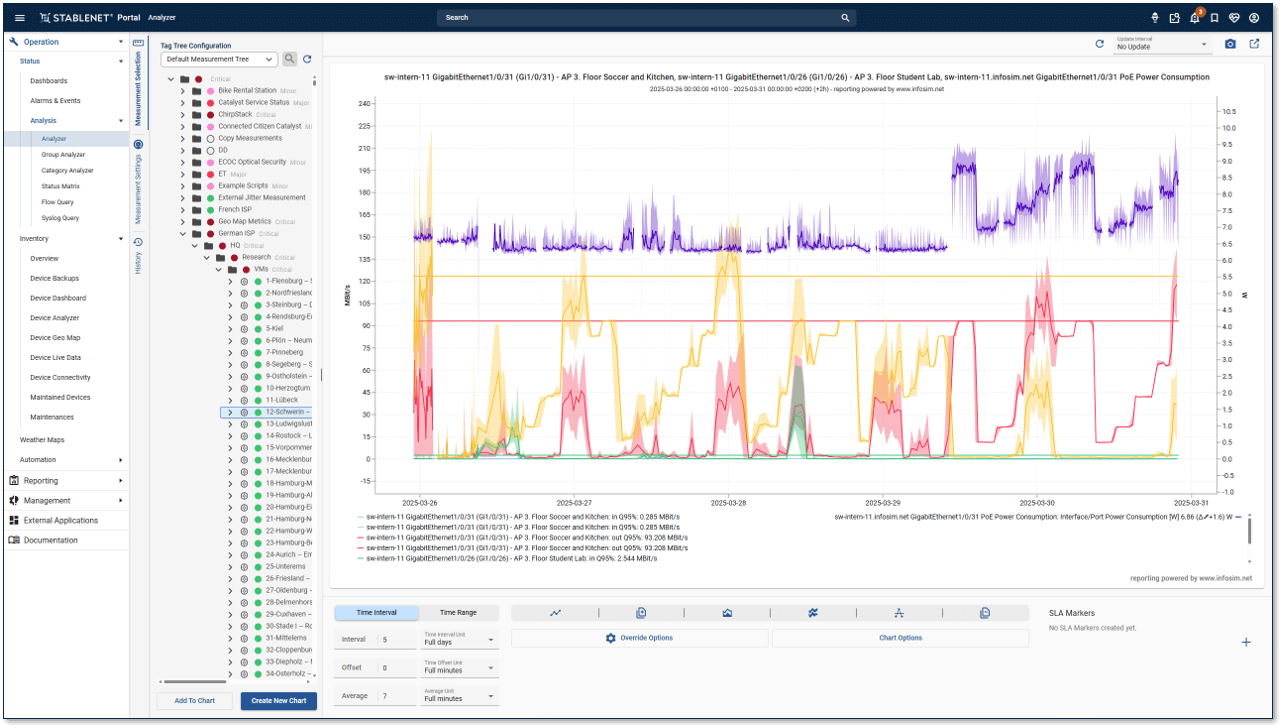
Charts & Graphs
Complement your network maps with charts and graphs that visualize key performance metrics such as bandwidth usage, latency, and interface load. These visual elements turn raw data into actionable insights, making it easier to spot trends, compare performance across devices, and detect anomalies before they affect users.
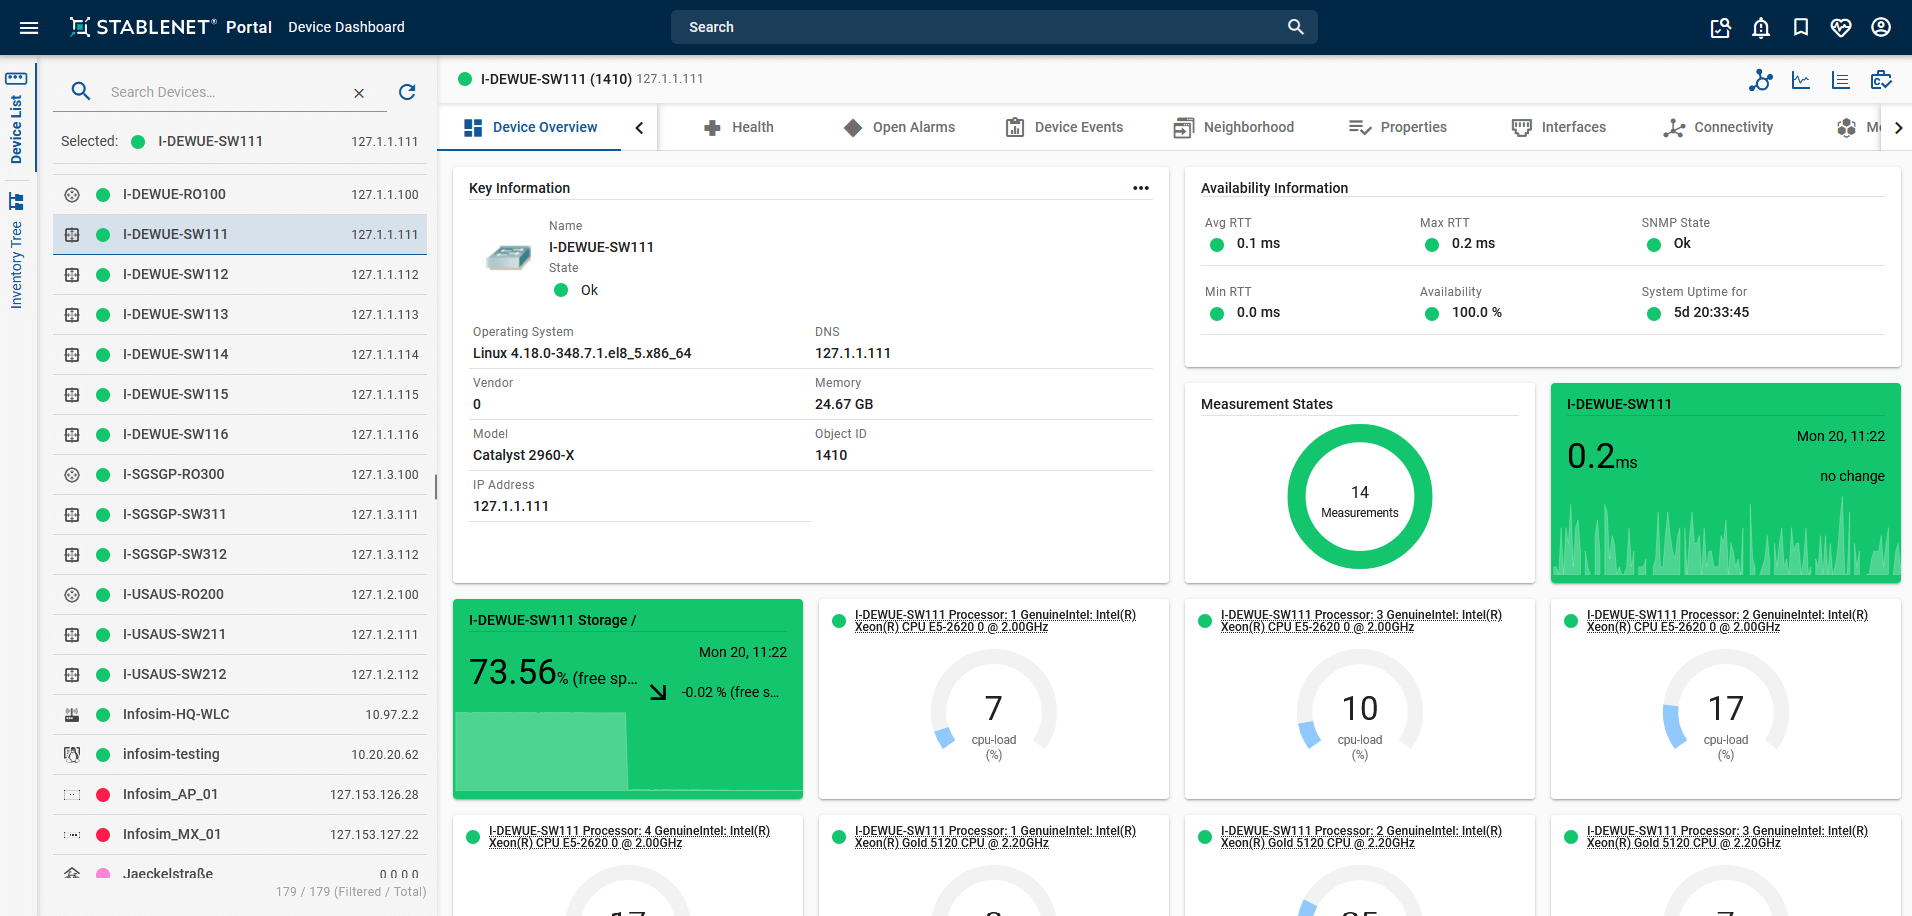
Dashboards
StableNet®’s dashboards bring all your network visualizations together in one place. Combine maps, charts, and health indicators into customizable views tailored to your role — from high-level overviews for management to detailed operational dashboards for NOC teams. Dashboards make it easy to track KPIs, monitor incidents, and ensure network reliability in real time.
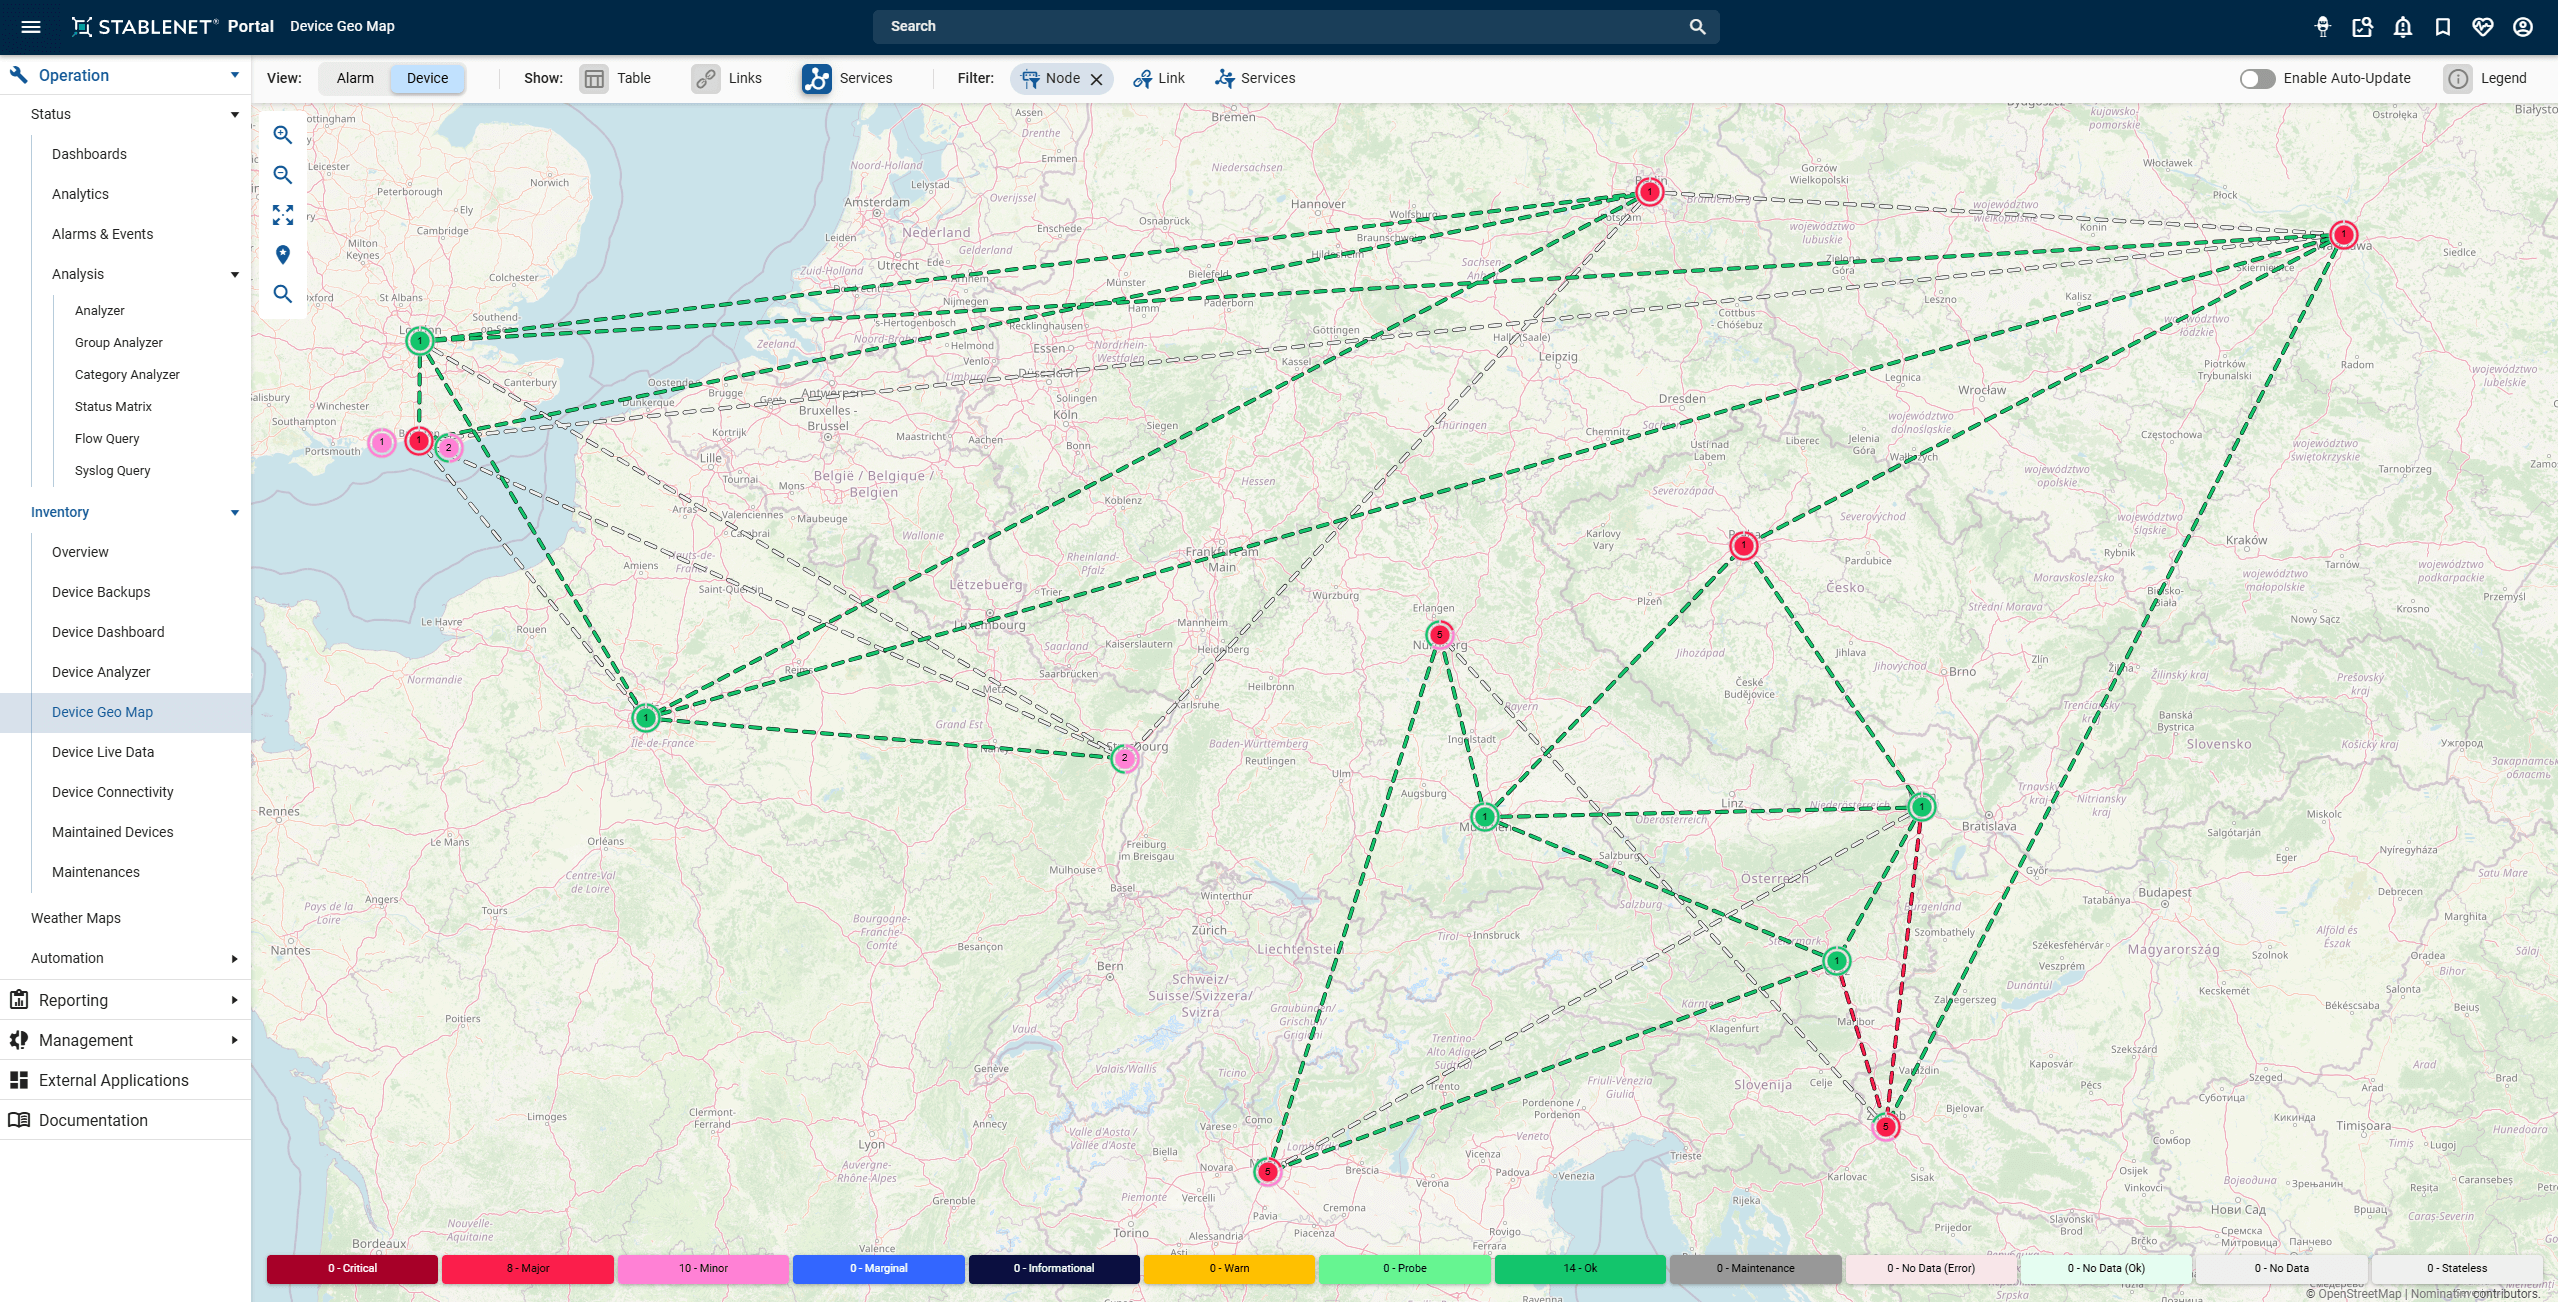
Service Analyzer
The Service Visualizer in StableNet® goes beyond traditional monitoring by offering a dynamic, real-time view of your entire service landscape. It enables network operators to see services and dependencies visually, filter by technology or protocol, and drill down into specific instances for deeper insights. Choose between logical or neighborhood views to explore how services interact, or use topography and “weather map” views for intuitive performance awareness.
Beyond Simple Visualization
StableNet® goes far beyond basic diagrams, maps, and charts. Its unified visualization approach transforms raw network data into clear, actionable insights — helping you make real-time, informed decisions about your infrastructure. StableNet® turns complexity into clarity so you can proactively optimize performance, prevent outages, and maintain full operational control.
4 Reasons to Choose StableNet® for Network & Service Visualization
Unlike traditional tools that only display static maps or graphs, StableNet® provides a holistic, automated approach to network visualization. It connects discovery, monitoring, and performance data in real time — so your visualizations always reflect the true state of your network.
StableNet® covers everything from monitoring and fault detection to automated configuration and real-time inventory discovery. It unifies the management of multiple vendor-specific network tools and technologies, along with firm-specific databases, into one GUI.
Superior Scalability
No matter the size or pace of your network growth, StableNet® adapts. Our solution has flexible deployment models and cost-effective options. This allows it to grow from small setups with only a few network devices to large global systems.
Automation is at the core of StableNet®. Save time and cut costs through intelligent workflows — from network discovery and root cause analysis to configuration tasks, backups, and reporting. No heavy coding required. StableNet® helps you simplify even the most complex, custom tasks — while driving down both OPEX and CAPEX.
Tailor your visualizations to match your organization’s needs. From detailed device-level maps to executive dashboards, StableNet® lets you customize network views, KPIs, and alert thresholds.

Trusted by Enterprises and Telcos Worldwide
StableNet® ’s proven scalability, flexibility, and vendor neutrality make it a preferred choice for organizations operating complex IT environments globally.
Find out why StableNet® is so popular. Request a demo today.

Software
Made in Germany
Our Use Cases on Network & Service Visualization
Unified Service Visualization
Get the Network Visibility you Need
FAQ: Network Visualization
What is network visualization?
Why is network visualization important?
What does a network visualization tool do?
How do network visualization tools work?
What are the benefits of network visualization?
- Faster fault detection and root cause analysis
- Improved understanding of network dependencies
- Simplified troubleshooting and capacity planning
- Better collaboration between technical and management teams
- Clear visibility into hybrid, multi-vendor, and multi-site environments
What types of network visualization exist?
- Topology Maps: Show the structure and interconnections of devices.
- Performance Graphs: Visualize KPIs such as traffic, utilization, and errors.
- Dashboards: Combine multiple views for real-time monitoring and reporting.
- Service Maps: Display dependencies between applications and underlying infrastructure.
What are network visualization best practices?
- Keep topology maps dynamic and automatically updated
- Integrate visualization with fault and performance management
- Customize dashboards for different user roles (e.g., NOC vs. management)
- Use color coding and alerts to highlight critical status changes
- Regularly validate discovery data for accuracy
What is the difference between network visualization and network topology mapping?
Network topology mapping, on the other hand, focuses specifically on the physical and logical structure of a network — showing how devices are connected and how data flows between them.
StableNet® combines both: it provides topology maps for structural insight and visual analytics for real-time monitoring and performance tracking.
How can automation improve network visualization?
This eliminates human error, saves time, and ensures that every visualization reflects the true current state of the network.
How does StableNet® handle multi-vendor network visualization?
What makes StableNet® different from other network visualization tools?

Software
Made in Germany
