Regular posts on all things around automated network & service management
Network Automation Insights
Stay tuned and keep informed with our blog series about the future of automation in network and service management

Network Automation – Monitoring and Tagging (Part 3 of a 3-Part Series)
July 11th 2022, Würzburg
This post is part of the ongoing blog series about Network Automation. Click here to see all parts.
Welcome back to the third and final part of a three-part series on how monitoring and tagging can be used in StableNet® to open up a whole new world of automation possibilities to facilitate your workflows, increase reliability and free up resources. While we began our discussion in Part 6a and Part 6b introducing measurements and monitors, which included looking at a couple unique measurement concepts such as SNMP, derived, status, script and dynamic measurements, we will conclude in a similar vein and look at a few more examples here as well as defining some tagging concepts and some final thoughts on Monitoring Automation.
External Measurement
External measurements collect data from data sources that do not support any of the traditional protocols (SNMP, WMI, syslog, traps, etc.). Every external measurement refers to a template, which defines the monitors for that measurement with a set of keys (Key Device, Key X, Key Y, Key Z).
This method uses a script (in contrast to a protocol) to fetch data entries and assign them by specifying these keys. The external script sends the data to the StableNet® Agent where the values get imported into the matching external measurement. Measurement data with keys that do not match any measurement are discarded.
External measurements are somewhat like other script measurements. However, this methodology uses a more generic measurement envelope and has broader applicability and can be used for very different purposes.
For example, external script measurements provide an efficient method when massive amounts of data (e.g., from CSV formatted output files) need to be imported at one time when they occur. Another prominent use case are custom scripts that execute REST calls to endpoints and monitor the collected measurement values with StableNet® inbuilt monitoring tools.
Monitors are associated to Measurements
StableNet® measurements (i.e., data gathering) and their associated monitors (i.e. KPI definitions) are created automatically once defined in the discovery as discussed in blog post Network Automation for Discovery & Inventory (Part 4).
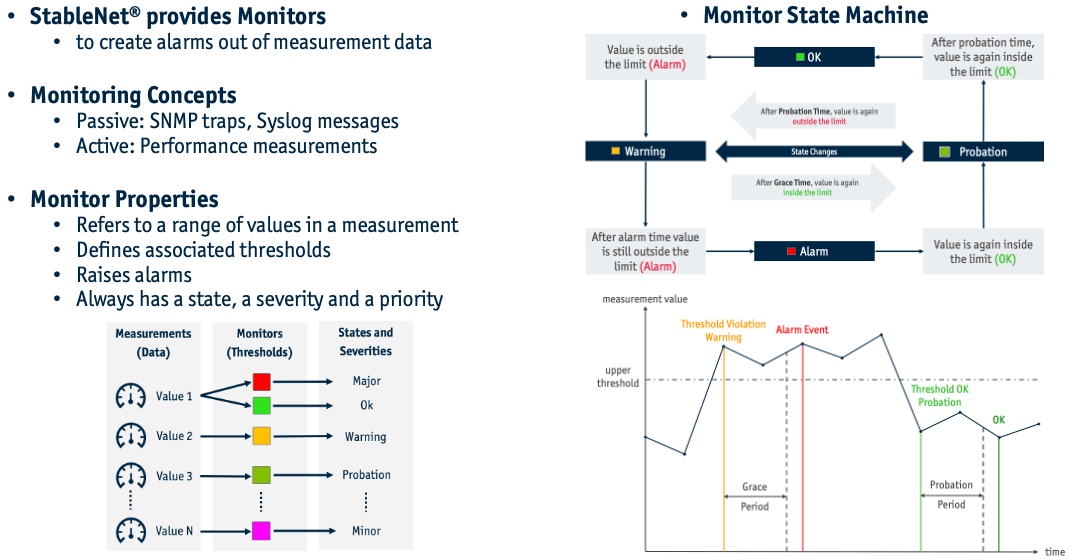
Every measurement can be under control of one or more monitors and each monitor watches different values of a measurement. A monitor has one or more intervals to mark valid measurement data points.
Multiple monitoring ranges can be defined as an escalation path to raise alarms with increased severities in case a specific situation gets worse over time (e.g., a monitored memory, CPU or disk capacity gets exhausted).
The below chart summarizes StableNet® event monitoring concepts and illustrates the underlying state machine behavior on different threshold violations.
Automatic Root Cause Analysis
One goal of network management is to find the root cause of problems. The data set is created by monitoring different KPIs that measure network health. Each KPI monitor has three important states: Ok, Alarm and Unknown.
If the monitor is in Ok state, the system presents first-rate performance. In Alarm state the monitored KPI has crossed predefined thresholds. If the monitor cannot be determined its state is Unknown. Usually, this applies for a broken network connection that prevents reading the monitor state.
In a typical scenario when the link to a device is broken, that device becomes unavailable. This network failure causes several monitors to enter the Alarm state, as the link state is down and all services on the device are also unavailable. All monitors of the device which are in alarm state are symptoms of the network connection problem. The whole root cause comes down to that link and other symptoms depend on it. Once fixed the symptoms automatically disappear.
The capability to find the root cause of network problems, requires a mechanism that tracks which monitors depend on others. Apart from that it is important to realize that dependencies only reveal possible root causes. However, detecting the real root cause is an additional task of an inbuild algorithm. That automated analysis finds the root cause and symptoms for all monitors currently in alarm state. Each alarm has exactly one root cause, which can be the monitor itself. Every root cause includes dependent monitors that represent its symptoms.
The impact analysis highlights the real problem of all alarmed monitors to identify all possible root causes. This guides the operator to the most focal points of network problems. Notifications are sent to administrators via alarm mails, SMS or other means of transmittal. The root causes are also displayed in the StableNet® GUI including their symptoms.
Tagging Concepts
Tagging is a very powerful and fundamental tool in StableNet®. Tree structures and filtering are processed on the basis of tagging. Therefore, this concept is essential for platform usage.
Important Terms and Definitions
Before we get into capabilities and explore use cases we need to introduce and explain some key definitions: Tag: A tag consists of a tag category and a tag value. Tags can be attached to many objects in StableNet® to store any kind of meta information. Those objects are also referred as taggable objects. E.g., tags are attached to devices, measurements, monitors etc. By default, taggable objects already come with plenty of preconfigured tags. For example, measurements will have a tag of the category ‘measurement category’ (Interfaces, Processors, etc.) by default. Most of the tags can be freely added, deleted, or changed by users. They are called Custom Tags. There are also Attribute Tags which are not directly changeable. Both Custom Tags and Attribute Tags can be inherited. Tag Category: Tag categories group tags with the same function. Once created, they can be used globally for multiple objects. For example, measurements have a tag with the tag category ‘measurement category’, which separates different kinds of measurements (e.g., processors, interfaces, routing, syslog, …). Tag Value: A tag value is assigned to one single object. For example, a measurement has a tag with the tag category ‘measurement category’. The value of this tag could be Interfaces, which would allow all measurements having that tag value to be grouped together. In a tree, this appears as folder ‘Interfaces’ that contains all measurements with this tag value. The Interface folder is shown in the tag tree comparison example later. The next screenshot shows how tag category and associated tag values are presented in StableNet®.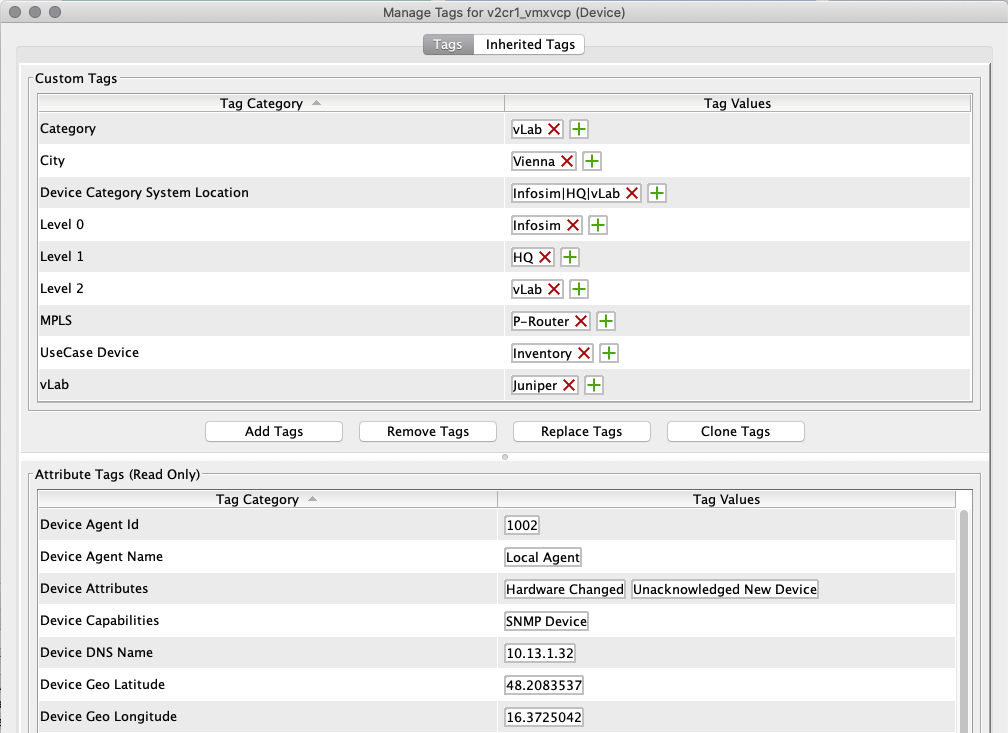
Attribute Tags: Attribute tags translate to a standard set of tags which are automatically generated by StableNet® and cannot be modified. They are used to store values that represent attributes of tagged objects. For example, all devices will have a tag of the category ‘Device IP Address’ with their respective IP address as tag value.
Tag Domain: Objects in StableNet® are aggregated in tag domains, e.g. devices are represented by a tag domain ’Device‘, while their interfaces are in the tag domain ‘Interface‘. This allows the description of general relationships like ‘Devices have Interfaces’ within StableNet®.
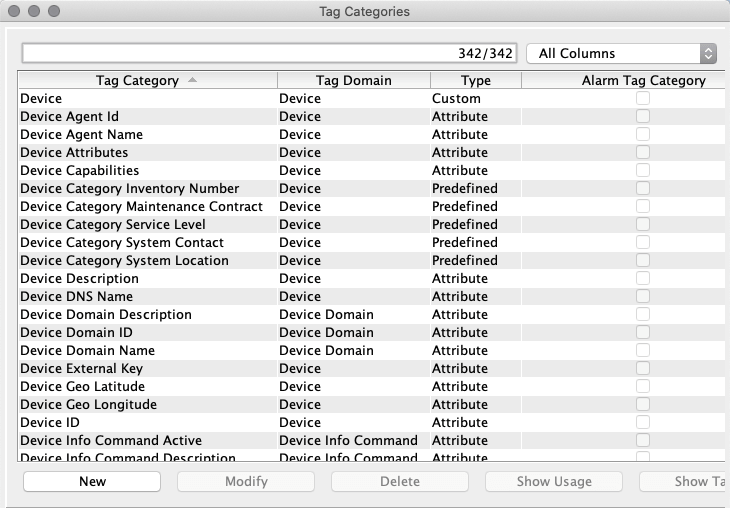
Tag Tree: StableNet® comes with a fixed number of tag domains to create different tag trees depending on individual requirements. For example, the Measurement Tree consists of the tag domains ’Device‘, ’Measurement‘, and ’Monitor‘. Removing the tag domain ’Measurement‘ from this tag tree example would result in a tag tree showing all monitors of a device.
Tag Filter: Automation actions for StableNet® objects are executed by different kinds of jobs, which can run on one or more devices. Tag filters then select the targeted devices based on tag categories, tag values, and tag domains. For example, a Configuration Job can have a tag filter matching any device with a name containing vLab. Expressed in tagging terminology, the tag filter would match all objects in the tag domain Device that have a tag with the tag category Device Name and a tag value containing vLab.
Things got somewhat abstract with all that terminology and definitions. Below are two tag tree examples to demonstrate a use case.
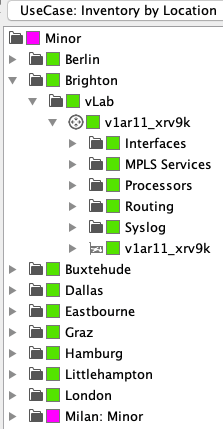
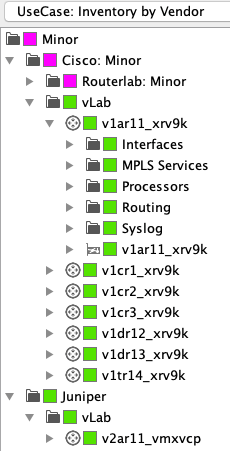
Both tag trees show the network inventory with the exact same devices. The left one is arranged by the tag values of their geo-graphic location, whilst the one on the right sorts these by device vendor.
Those tag trees can be easily created with filters based on criteria (by network, by region, by department, or by any other tag value combination), which are most relevant for current visualization or navigation requirements.
Tor more insights and examples that explore how tagging implementations work we have recently recorded a 20 min tagging tutorial video. The demos explain and demonstrate tag usage within StableNet®. It is titled StableNet® Tutorial – Tagging, Tag Filters, Tag Trees on YouTube.
Monitoring Automation – Final thoughts
In summary and conclusion: Monitoring a network is much more than collecting alarms, filtering them to certain criteria and acknowledge the fixed ones. Functional components like measurements, monitors, tagging and root cause analysis provide the core building blocks for monitoring automation in StableNet®.
In other words, for StableNet® users monitoring automation translates to the capability of continuously surveilling a heterogeneous infrastructure landscape, which consists of network devices, virtualized instances, computers, services, and applications to meet KPIs and SLAs, raise alarms based on their performance or failures, create logical dependencies that highlight out of range parameters and thus alert on how severe a particular problem is.
The underlying root cause analysis suppresses alarms that are subsequent and most certainly depend on an overarching problem to avoid alarm storms. Being able to organize, filter and visualize all that data with meta information by tagging that can be customized to your organization or troubleshooting needs is another aspect of powerful StableNet® monitoring automation.
As you made it up to this point of our “Monitoring and Tagging” blog series describing StableNet® concepts you probably like the entire idea to automate your network surveillance with intelligence that puts you in driver’s seat of control when things go wrong. If you are interested in getting to know our automated network management system StableNet® in detail, you can schedule a live demo.
This post is part of the ongoing blog series about Network Automation. Click here to see all parts.

Software
Made in Germany
