Regular posts on all things around automated network & service management
Network Automation Insights
Stay tuned and keep informed with our blog series about the future of automation in network and service management

Network Automation – Monitoring and Tagging (Part 2 of a 3-Part Series)
February 10th 2022, Würzburg
This post is part of the ongoing blog series about Network Automation. Click here to see all parts.
Part 2: Platforms and Workflows that Automate Operations
Part 3: Network Automation – Market Perspectives
Part 4: Network Automation for Discovery & Inventory
Part 5: Network Automation – Configuration Generation
Part 6a: Network Automation – Monitoring and Tagging (Part 1 of a 3-Part Series)
Part 6b: Network Automation – Monitoring and Tagging (Part 2 of a 3-Part Series)
Part 6c: Network Automation – Monitoring and Tagging (Part 3 of a 3-Part Series)
Welcome back to the second of a three-part series on how monitoring and tagging can be used in StableNet® to open up a whole new world of automation possibilities to facilitate your workflows, increase reliability and free up resources. While we began our discussion in Part 6a introducing measurements and monitors, which included looking at a couple unique measurement concepts such as SNMP and derived measurements, we will continue in a similar vein and look at a few more examples here.
Status (Syslog and Trap Distributor) Measurement
Status measurements are part of the distributed syslog and trap measurement system. A distributed measurement consists of two components, which are separated from each other. There is a global distributor, which works as a collector bucket measurement and a device specific measurement that is associated to a particular object.
Therefore only a few global trap and syslog measurements are required to update monitors on all devices in the network, that are configured with status measurements. A status distributor measurement defines a category key, which provides the linkage between the two components and is referenced in the associated device status measurement.
Distributed measurements are specifically designed to increase platform scalability for large networks with many elements that send bursts with trap and syslog traffic. They reduce the total amount of device specific measurements and thus the overall load within an automated monitoring system.
Script (Business Process) Measurement
Business process script modules extend StableNet® measurement and monitoring capabilities seamlessly beyond the infrastructure to include services and applications. The StableNet® Agent executes specified scripts at every measurement interval, reads the returned results, and stores them in the database. Communication between a StableNet® Agent and the business process script is implemented via command line and stdout. StableNet® comes with a script repository and housekeeping processes are facilitated by the Agent Expert.
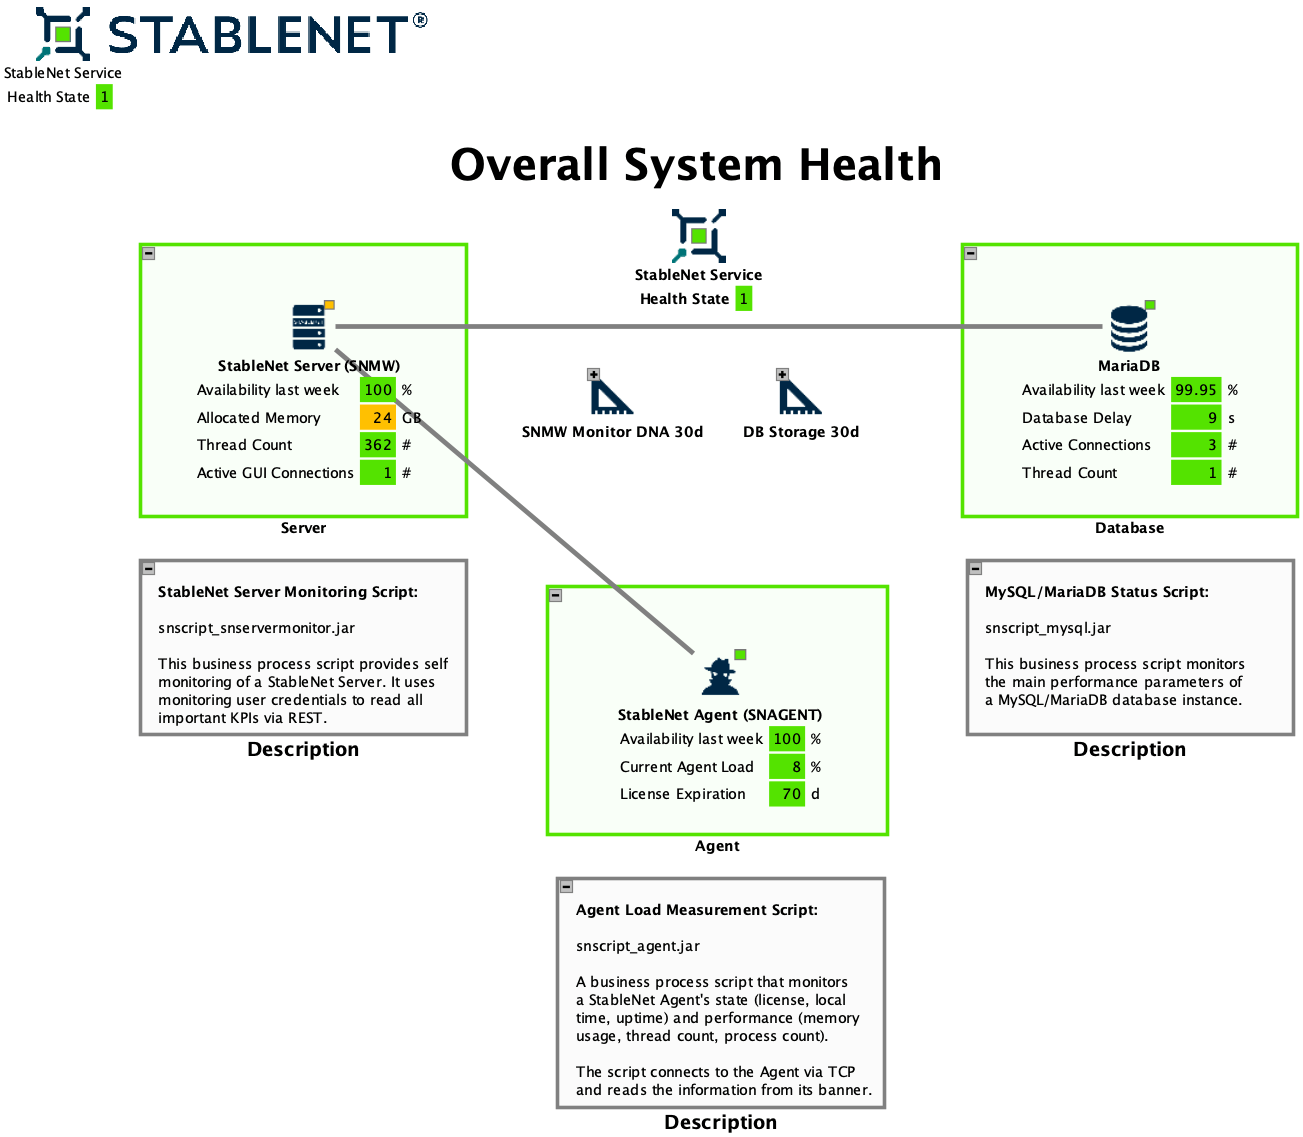
A prominent example of business process scripts that should be configured in every installation is StableNet® Self-Monitoring. This surveils the entire platform comprised of Server (SNMW), agent (SNAGENT) and database (typically MariaDB).
The above screenshot shows a weather map example to monitor and visualize an entire StableNet® deployment with business process scripts.
Dynamic Rules Generation (Measurement)
Another useful measurement tool is Dynamic Rules Generation (DRG). This status measurement repeatedly generates a new dynamic monitor for each unique alarm that meets pre-defined filter criteria and works for syslog, trap, status, and script measurements.
DRG measurements (like all other measurements, monitors and tags in StableNet®) are defined within the Discovery engine for automated deployment and configured at measurement level. The dynamically created monitors only react on the value that is automatically inserted in the ‘Dynamic Rule Key Filter’ property. The first occurring alarm event that meets the matching criteria will trigger monitors with activated DRG.
Here is an implementation example for a simple DRG usage. Define a Regular Expression to filter syslog messages with a monitor that automatically tracks e.g. username, source IP and port from every network device login to raise an alarm with its associated severity.
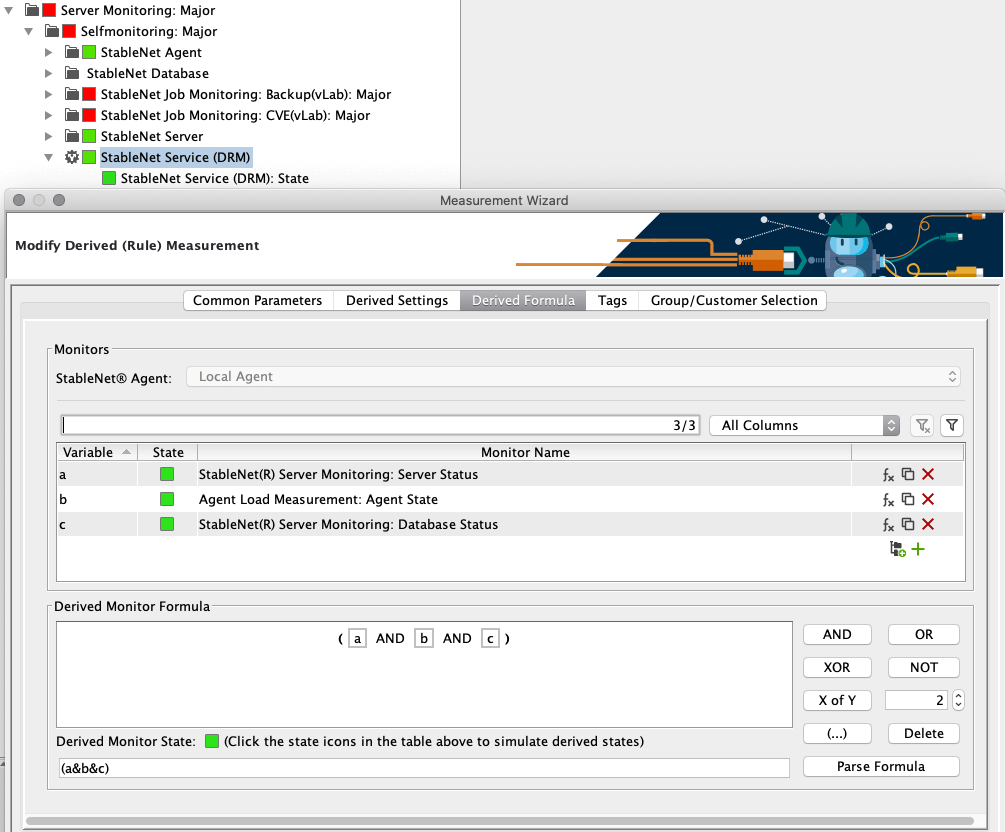
Below is a screenshot from the DRM status logic configuration as configured in the previous StableNet® Self-Monitoring example. This measurement determines the health state of all platform components in its entirety.
In case one of the underlying Service KPIs (a, b, c) gets violated in that logic, the entire StableNet® platform health state is considered to be at a stability risk and thus raises a major alarm to take appropriate action (ideally in advance).
The end … for now
That’s it for the second part of this continuing blog series. In the next post we will have a look at external measurements as well as how these overlap with monitors in StableNet®. So stay tuned…
This post is part of the ongoing blog series about Network Automation. Click here to see all parts.
Part 2: Platforms and Workflows that Automate Operations
Part 3: Network Automation – Market Perspectives
Part 4: Network Automation for Discovery & Inventory
Part 5: Network Automation – Configuration Generation
Part 6a: Network Automation – Monitoring and Tagging (Part 1 of a 3-Part Series)
Part 6b: Network Automation – Monitoring and Tagging (Part 2 of a 3-Part Series)
Part 6c: Network Automation – Monitoring and Tagging (Part 3 of a 3-Part Series)

Software
Made in Germany


