StableNet® Blog
How to analyze Flow Data with StableNet®
Oct 26, 2018 | Blog, Network Management
Flow data can be one of the best tools a network engineer can use to track down issues. Flow data can be used for a variety of troubleshooting tasks, including:
- Network performance
- Capacity planning
- Security audits
- … and more
The key to understanding how to analyze flow data is first to understand what information is contained within flow exports, and then we can see what to do with that data. In this article, we will explore flow (NetFlow, IPFIX, SFlow…) and then see how to analyze that data with StableNet®.
The best way to describe flow data is to call it meta data, i.e. information “about” the data, without exposing the actual data. I think a good way to understand this is to think about mailing a package like a FedEx. If you could inspect the package, you could get a lot of information about the delivery. You could know who sent it, and to whom it was being sent. You could also get some valuable information about it like how big it is, how heavy and so forth. You couldn’t see “inside” the package, so the contents wouldn’t be exposed, but you could still “know” quite a lot of “meta data” about it.
The same is true for flow. Contained within the flow exports are valuable pieces of information about the packets being sent across your network. Information like:
- Input interface index used by SNMP (ifIndex in IF-MIB)
- Output interface index or zero if the packet is dropped
- Timestamps for the flow start and finish time, in milliseconds since the last boot
- Number of bytes and packets observed in the flow
- Layer 3 headers:
- Source & destination IP addresses
- ICMP type and code
- IP protocol
- Type of Service (ToS) value
- Source and destination port numbers for TCP, UDP, SCTP
- For TCP flows, the union of all TCP flags observed over the life of the flow
- Layer 3 routing information:
- IP address of the immediate next-hop (not the BGP next-hop) along the route to the destination
- Source & destination IP masks (prefix lengths in the CIDR notation)
Also, many new vendor-specific forms of flow exist which provide even greater level of detail and more granular information. Cisco, Juniper, Ixia, Alcatel-Lucent, Huawei, and others support some level of flow customization within their devices.
The StableNet® Agent can be licensed to be a flow collector. So, you would point your flow-enabled devices like routers, switches, firewalls, probes, etc. to send their flows to the IP address of a StableNet® Agent. From there you can use the StableNet® GUI as well as the new StableNet® Flow Portal to investigate the collected flow data.
Flow data can be analyzed within StableNet® in 2 main ways:
- Through real-time ad-hoc analysis (Agent Flow Query or Flow Portal)
- By setting up a specific measurement for longer term analysis (StableNet® Analyzer)
Let’s look at each of these in more detail.

Matthias Schmid
Solution Manager at Infosim®
Author
I. Agent Flow Query
The Agent Flow Query area is located within the Agent Theme of the client GUI. This area should be used for creating quick ad-hoc analyzer reports of flow data, especially if the user is already in the client GUI and just needs to grab some information quickly.
The user first selects which agent they want to gather flow data from, and then can use the main flow query screen to set any filters/parameters they wish before plotting the data.
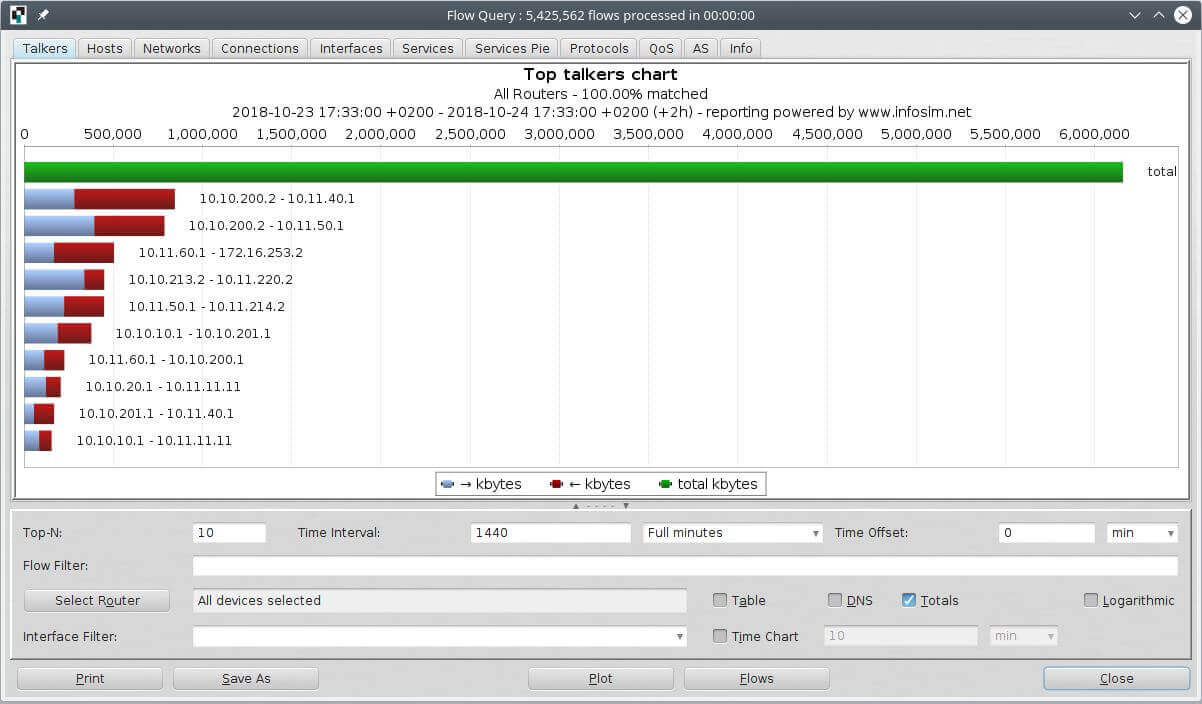
They can then select from one of the tabs at the top to organize and view the flow data from a variety of perspectives like:
- Talkers
- Hosts
- Network connections
- Interfaces
- Services
- Protocols
- QoS
- AS
- Info (which provides raw data about the flow exports themselves)
II. Flow Portal
New in version 8.3 is the web-based Flow Portal. This easy-to-use and highly graphical module allows for more sophisticated analysis including things like drill-down functionality and easier to use filtering.
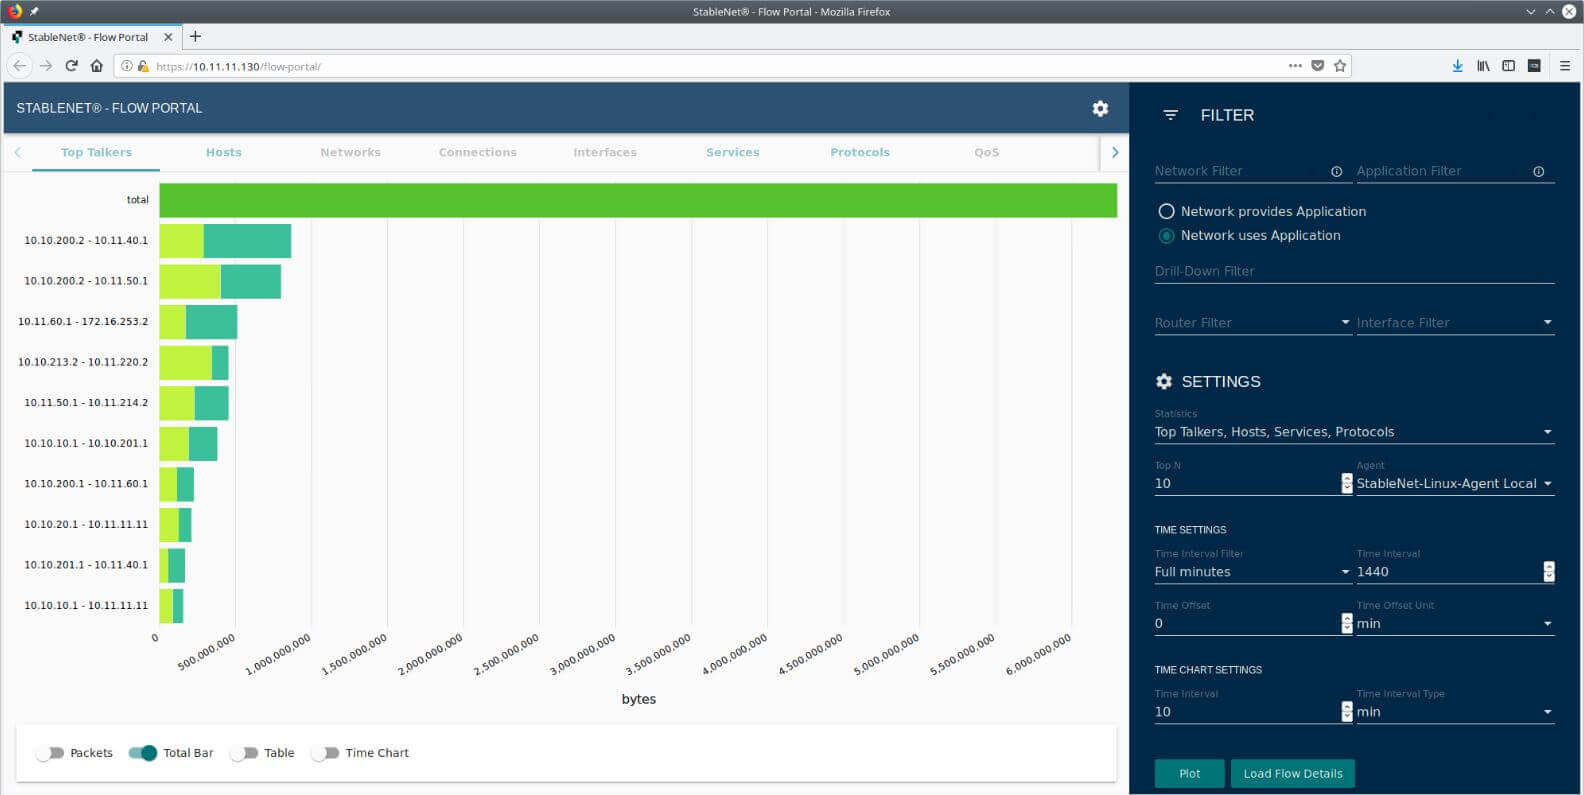
The Flow Portal results area is similar in layout to the Agent Flow Query, with links at the top of the page for talkers, hosts, connections, etc. but now also adds an easy-to-use Filter and Settings area built into the portal.
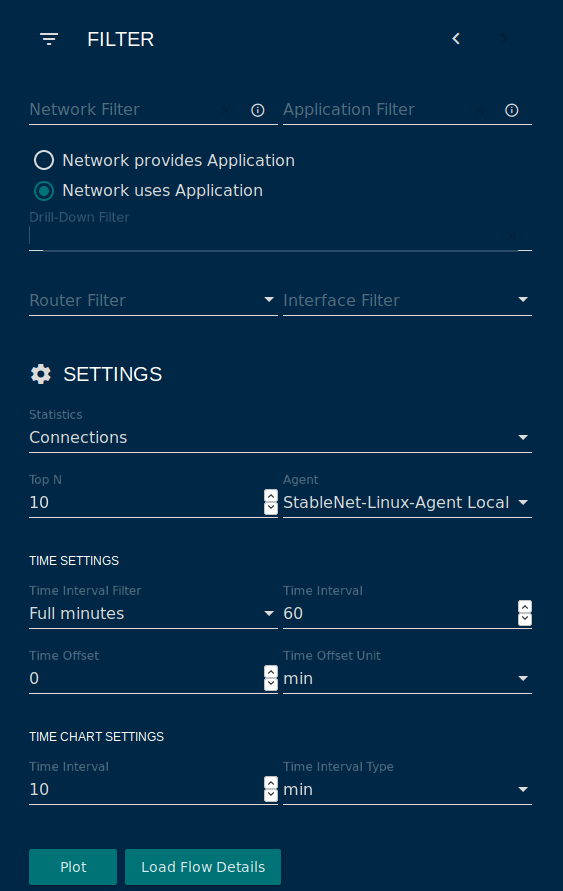
The user can now quickly type in or check off the parameters they want, and then click on Plot to load the results in the main flow report screen. In the main view, users can now do things like click on a top talker bar to drill down into the specific connections which make up those talkers’ conversations – and then further drill into a specific connection to see the raw flow details about that conversation.
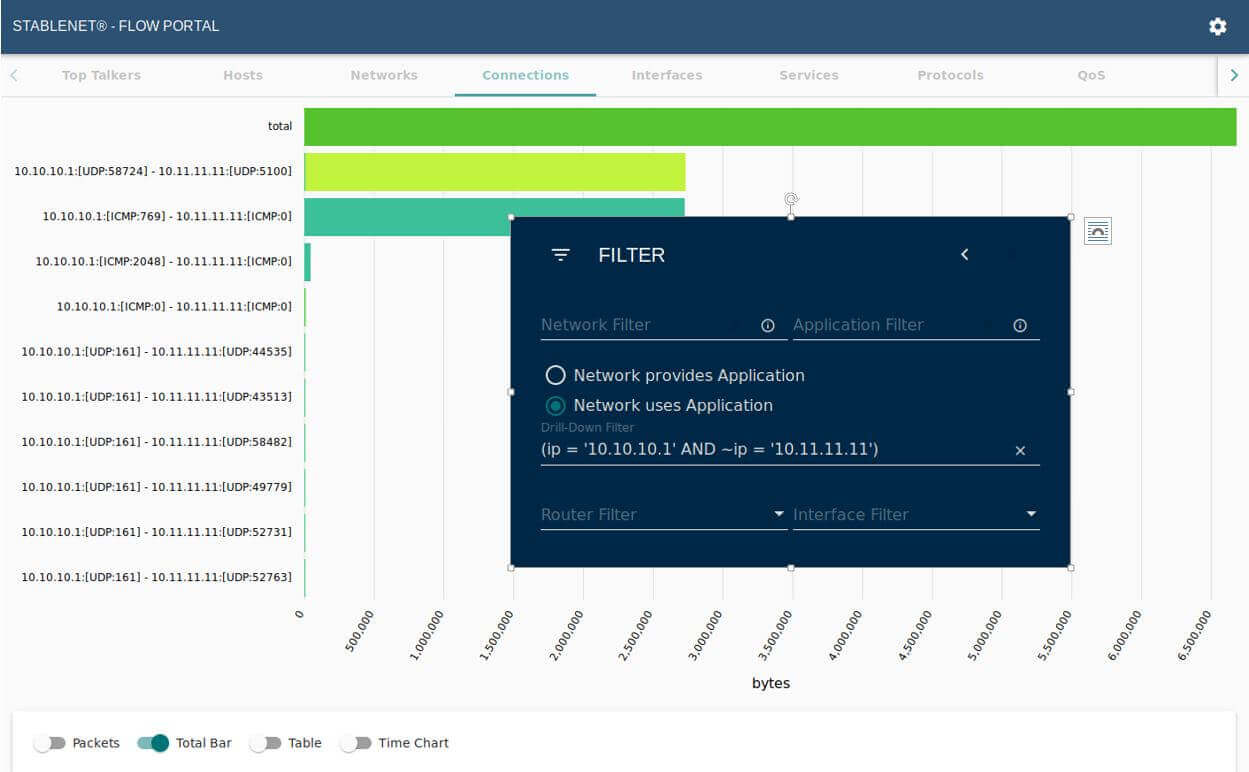
This type of drill-in functionality greatly speeds up the time to troubleshoot issues when they occur.
III. Flow Measurements
Back in the main client GUI, users can create new measurements for long-term flow reports. These measurements can take the form of a flow rule, or a flow statistic.
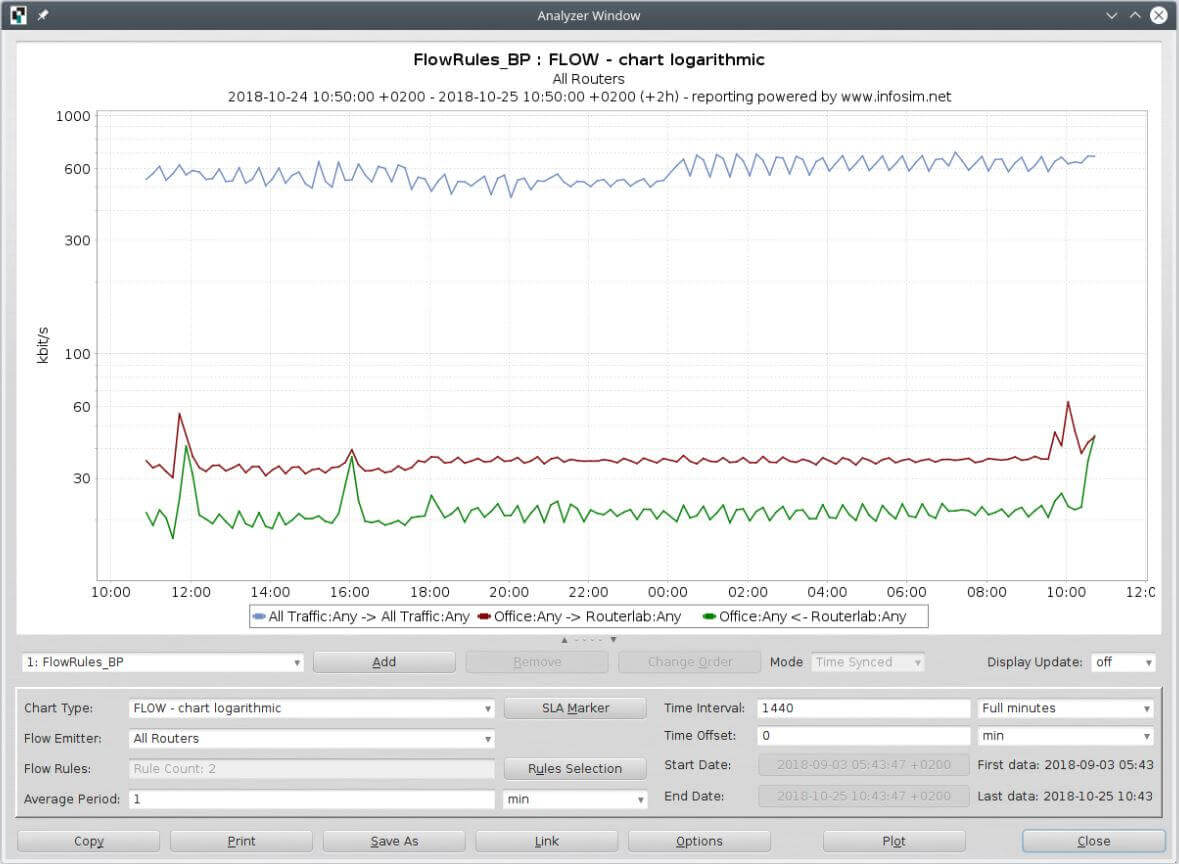
Flow rules allow for the creation of advanced network or application rules which can filter the flow data down to only match on very specific user-desired parameters. For example, if the user wanted a report that just shows email traffic between two IP subnets, they could create rules which match on the email ports (25, 587, 110…) and also set up a filter for the subnets they want to look at. Then they can create an analyzer view to just display that result.
By having a measurement, you can also now create monitors on the flow data to alert on things like the total number of flows, router traffic, packet size, matched flows, and so on. That way, a user can get an alarm if StableNet® detects too much (or not enough) traffic which can be a great indicator of network issues.
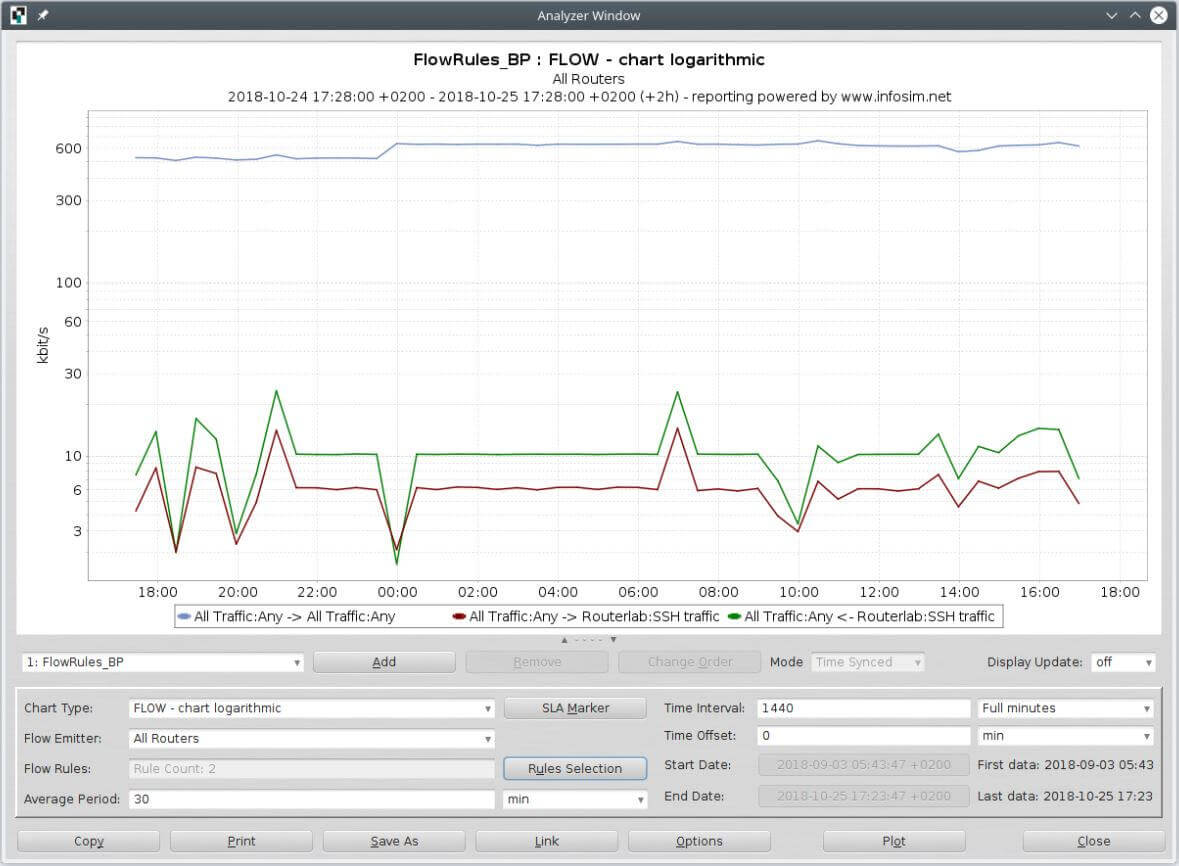
By utilizing the many flow analysis features of StableNet®, network engineers can dig much deeper into the details of their traffic for both real-time troubleshooting as well as long-term health and capacity/trending data. Also, the seamless integration of Flow Analysis is a key feature of StableNet® as Unified Network and Services Management Solution.
Author

Matthias Schmid
Solution Manager at Infosim®

Software
Made in Germany
